728x90

https://www.inference.vc/causal-inference-3-counterfactuals/


Causal Inference 3: Counterfactuals

Counterfactuals are weird. I wasn't going to talk about them in my MLSS lectures on Causal Inference, mainly because wasn't sure I fully understood what they were all about, let alone knowing how to explain it to others. But during the Causality Panel, Dav

www.inference.vc


Counterfactuals


Conterfactual이라는 용어가 딥러닝 논문에서도 한번씩 나오는데 사실 이해하기 너무 어렵다.

counterfactual의 확률적 용어상의 정의는 다음과 같다.

 - a probablilistic answer to a "what would have happened if" question -

("만약 그랬다면 어떻게 되었을까"라는 질문에 대한 확률적 대답)


이번 글에서는 Counterfactual 용어에 대한 이해를 여러가지 예시를 통해 이해해본다.


Example 1: The election example


Given that Hilary Clinton did not win the 2016 presidential election, and given that she did not visit Michigan 3 days before the election, and given everything else we know about the circumstances of the election, what can we say about the probability of Hilary Clinton winning the election, had she visited Michigan 3 days before the election?

(힐러리 클린턴이 2016년 대선에서 승리하지 못했고, 선거 3일 전 미시간주를 방문하지 않았다고 하자. 선거 상황에 대해 아는 모든 것을 감안할 때 힐러리 클린턴이 3일 전 미시간주를 방문했다면 당선 가능성에 대해 어떻게 말할 수 있을까.)


이를 해석하면 다음과 같다.


Let's try to unpack this. We are are interested in the probability that:

  • she hypothetically wins the election (그녀가 선거에 이길 확률)

conditionied on four sets of things:

  • she lost the election (그녀는 사실은 선거에서 졌다.)
  • she did not visit Michigan (그녀는 미시건에 방문하지 않았다.)
  • any other relevant an observable facts (여러 다른 관측할 수 있는 사건들)
  • she hypothetically visits Michigan ( 만약 그녀가 미시건을 방문했다고 가정했을 때)


위의 상황을 보면 힐러리 클린턴이 선거에서 졌는데, 선거에서 이길 확률을 알고 싶어한다던가,

미시건에 사실은 방문하지 않았는데, 방문했다고 가정하는 등, 왜 이런일을 하는지 의문이 들 수 있다.


그러나 정치적 분석을 할 때, 왜 힐러리 클린턴이 졌는지 분석한다면, 다음 선거에서 이길 수 있을 것이고,

이러한 이유 때문에 counterfactual 분석을 하게 된다.


Example 2: Counterfactual fairness


Given that Alice did not get promoted in her job, and given that she is a woman, and given everything else we can observe about her circumstances and performance, what is the probability of her getting a promotion if she was a man instead?

(앨리스가 직장에서 승진하지 않았고, 그녀가 여자이고, 그녀의 상황과 실적에 대해 우리가 관찰할 수 있는 모든 것을 고려할 때, 그녀가 남자였다면 승진할 가능성은 얼마나 될까요?)


이러한 counterfactual question의 특징 중 하나는 바로 specific datapoint에 대한 결과를 질문한다는 것이다.

위의 예에서는 전반적인 승진과정에 대한 fairness를 묻는 것이 아니라, 'Alice' case에 대한 결과만을 묻는다는 것이다.


또한 counterfactual은 우리가 실제로는 수행할 수 없거나 힘든 intervention을 포함하고 있다는 것이 또 다른 특징이다.

(위의 예시에서는 Alice는 실제로는 남자가 될 수 없다. 그러므로 남자가 되었을 때의 실험을 수행하는 것은 불가능하다.)


Example 3: My beard and my PhD


Given that I have a beard, and that I have a PhD degree, and everything else we know about me, with what probability would I have obtained a PhD degree, had I never grown a beard.

(제가 수염을 기르고 있고, 박사학위도 있고, 저에 대해 알고 있는 다른 모든 것들이 있다고 가정할때, 제가 수염을 기르지 않았다면, 박사학위를 받았을 확률이 얼마나 될까요?)


이 예시를 실제로 계산해보기 전에 한번 직관적으로 생각해보자. 수염을 기르는 것과 박사학위를 받는 것과 관련이 있을까? 아마 없을 것이다. 수염을 기르던, 안 기르던 공부는 열심히 했을 것이고, 어찌되었든 박사학위를 받았을 것이다.

그러므로 직관적으로 생각해 봤을때, 위의 예시의 확률을 아마 1에 가까울 것이다.

(수염을 기르지 않았을때, 박사학위를 받았을 확률)


Observational queries


다음은 위의 예시의 확률을 살펴보기 위해 수집한 data이다. feature로는 beard, married, fit, PhD가 있다.
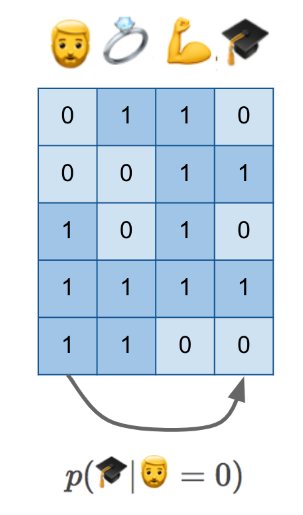


이 data로부터 p(🎓|🧔=0)를 구하면 우리가 원하는 결과를 얻을 수 있을까?

안타깝게도 그건 불가능하다. 우리가 직관적으로 생각했을 때, p(🎓|🧔=0)는 1이 되어야 한다.그러나 위에서 p(🎓|🧔=0)를 계산하면 0.5가 나온다. 물론 데이터양이 충분하다면 이러한 문제는 해결될 수도 있지만,어찌되었든 counterfactual 문제에서 궁금한 인과관계에 대한 해답은 찾을 수 없다.


intervention queries


결론적으로 이 문제를 풀기 위해서 우리가 해야 되는 것은 p(🎓|do(🧔=0))를 구하는 것이다. (not p(🎓|🧔=0))이때 p(🎓|do(🧔=0))를 구하기 위해서는 dataset과 더불어 causal diagram이 필요하다.


이렇게 causal diagram이 있으면 우리는 실제로는 불가능하지만 가상으로  distribution을 생성할 수 있다. 위의 예에서는 원래는 수염이 있는 사람들을 수염이 없는 상태로 가상으로 distribution을 만들어 내어서 p(🎓|do(🧔=0))를 계산하고 있다.


그러면 p(🎓|do(🧔=0))가 우리가 원하는 counterfactual probability를 설명하는 것이 맞는가? 사실 p(🎓|do(🧔=0))는 counterfactual probability를 설명하는 것은 아니다. 


위의 counterfactual probability 예시를 보면 특정 사람 (ex: Alice, me)에 대해서 원하는 상황의 확률 값을 계산하는 것을 볼 수 있다. 그러나 p(🎓|do(🧔=0))의 경우 특정 사람 (me)가 아닌 randomly sampled individual에 대한 확률이다. 


Counterfactual queries


counterfactuals에 대한 설명을 끝내기 위해 stuctural equation models를 소개하려고 한다.


stuctural equation models은 causal graph보다 변수간의 관계를 좀 더 explicitly하게 나타낸 그림이다.

(출처 : https://jmlr.org/papers/v14/bottou13a.html)


위 그림이 나타내는 각 변수간의 관계도는 다음과 같다.
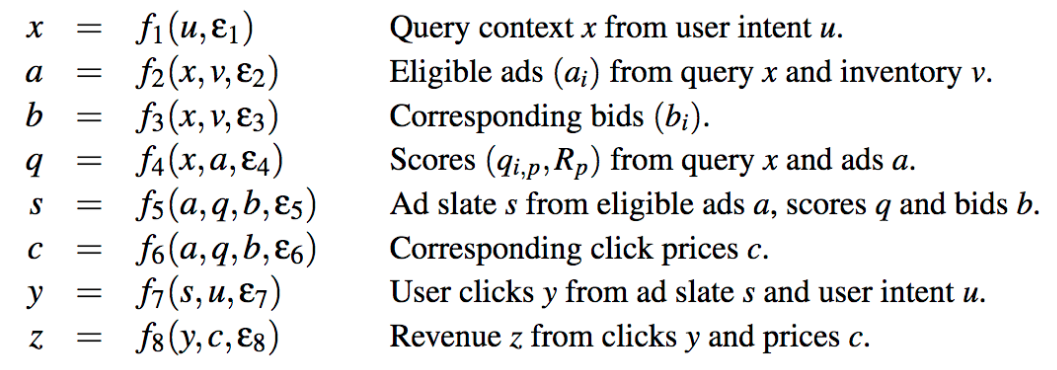
이 SEM (The structural equation model)은 causal graph가 담고 있는 정보를 모두 담고 있으며, intervention 또한 해당되는 function을 제거함으로 표현이 가능하다.


Back to the beard example


그러면 SEM 모델을 위의 beaed 예시에 적용해 보면 어떨까?

위 그림과 같이 표현이 가능하다. 위에서 f1이 제거되는 것이 intervention을 의미하며 (수염이 없을 시를 가정하는 것)

왼쪽의 입실론1,2,3가 각 사람에 대한 확률 noise값을 의미한다.


이렇게 입실론 변수가 각 사람별로 추가됨으로서, 사람별로 intervention이 적용되었을 때의 결과를 추론하는 확률 모델을 만들 수 있으며, 따라서 우리가 원했던 counterfactual에 대한 확률을 계산하는 모델을 만들 수 있게 된다.


결론적으로 counterfactual에 대한 설명은 아래와 같이 할 수 있다.


"making a prediction about features of the unobserved twin datapoint based on features of the observed datapoint."


수학적으로 나타내면 아래와 같다.


p(🎓|🧔=0,🧔=1,💍=1,💪=1,🎓=1)


이때, *로 표시된 것이 바로 unobservable variable이다. *가 없는 것은 observable variable이다.


Summary


Despite it being untestable, and difficult to interpret, humans make use of counterfactual statements all the time, and intuitively it feels like they are pretty useful for intelligent behaviour. Being able to pinpoint the causes that lead to a particular situation or outcome is certainly useful for learning, reasoning and intelligence. So my strategy for now is to ignore the philosophical debate about counterfactuals, and just get on with it, knowing that the tools are there if such predictions have to be made.

728x90
728x90

https://www.inference.vc/causal-inference-2-illustrating-interventions-in-a-toy-example/


Causal Inference 2: Illustrating Interventions via a Toy Example

Last week I had the honor to lecture at the Machine Learning Summer School in Stellenbosch, South Africa. I chose to talk about Causal Inference, despite being a newcomer to this whole area. In fact, I chose it exactly because I'm a newcomer: causal infere

www.inference.vc


Three scripts


본 글에서는 앞서 살펴본 intervention이라는 개념을 Toy example을 통해서 살펴본다.

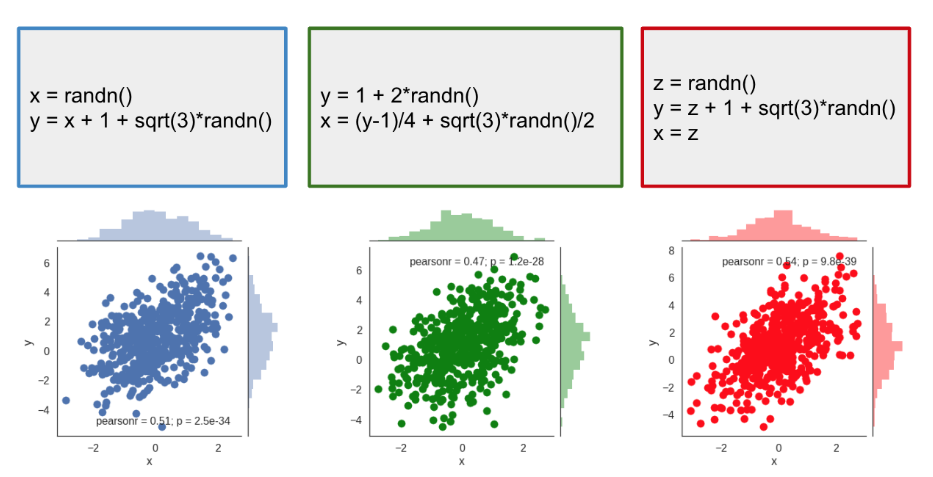
아래와 같이 실제로는 결과가 같지만 과정이 다른 3가지 gaussian distribution script가 있다.


이는 결과적으로는 모두 같기 때문에 결과를 봐서는 구분이 불가능하다.


Interventions


물론 이 3가지 scripts는 동일한 distribution을 나타내지만, 완전히 동일한 것은 아니다.

예를 들어 이 3가지 scripts에 interfere나 intervention이 들어가게 되면 다른 결과를 도출하게 된다.


예를 들어 나는 x가 3으로 고정되기를 원했고 그래서 아래와 같이 x=3으로 setting했다고 가정해보자.


이렇게 intervention이 이루어진 경우 다음과 같이 distribution이 바뀌게 된다.


이를 marginal distribution 형태로 표현하면 다음과 같다.


그러나 이러한 intervention이 들어가지 않은 경우에는 3개다 같은 distribution이다.


결론적으로 data의 joint distribution 정보만으로는 intervention이 적용되었을 때의 distribution을 알기는 힘들다는 것이다.


Causal Diagrams


이러한 상황에서 intervention을 적용했을 때, distribution을 어떻게 알 수 있을까?

바로 causal diagram을 이용하는 것이다.


아래 scripts 같은 경우는 아래와 같이 causal diagram을 그릴 수 있다.

이 causal diagram을 이용해서 실제로 어떤 setting에 대해서 실험을 하지 않아도

intervention distribution을 구할 수 있고, 이 부분에 사용되는 것이 바로 'do-calculus'이다.


이러한 intervention의 효과를  graphically하게 나타낸 것이 바로 causal diagram에서 mutilation (제거, 훼손)을 수행한 다음 그림이다.


이에 따라 intervention을 수행했을 때, distribution이 어떻게 바뀔지 우리는 sampling하지 않고도 예측이 가능하다.

예를 들어 맨처음 예시 같은 경우는 x=3으로 고정을 하면 그에 따른 영향을 받기 때문에. p(y|do(X)) = p(y|x)라고 생각할 수 있으나, 두번째 case의 경우는 x에 y가 관련이 없기 때문에 x=3으로 고정을 하더라도 p(y) 그대로 나옴을 알 수 있다.


실제로 아래와 같이 도출이 가능하다.


728x90

'Math > Causal Inference' 카테고리의 다른 글

Part 3: Counterfactuals  (0) 2021.07.21
Part 1: Intro to causal inference and do-calculus  (0) 2021.07.15
728x90

https://www.inference.vc/untitled/


ML beyond Curve Fitting: An Intro to Causal Inference and do-Calculus

Since writing this post back in 2018, I have extended this to a 4-part series on causal inference: ➡️️ Part 1: Intro to causal inference and do-calculus Part 2: Illustrating Interventions with a Toy Example Part 3: Counterfactuals Part 4: Causal Diag

www.inference.vc


causal inference에 대해 접한 적 있는가..? 아마 Bayesian network를 공부하면서 한번쯤을 보았을 것이다. (화살표로 인과관계 설명..) 그러나 요즘에 핫한 deep learning에서는 주로 causal inference를 사용하지 않기 때문에 접할일이 별로 없고 이것이 왜 중요하고 어떻게 사용되는지 접할일이 별로 없다. 그러나 causal inference는 deep learning을 보완하기 때문에 한번 공부해보자고 글쓴이가 말한다.. (Don't get discouraged by causal diagrams looking a lot like Bayesian networks not a coincidence seeing they were both pioneered by Pearl) they don't compete with, they complement deep learning.)


Basics


일단 causal calculus에서는 두가지의 conditional distributions을 구분한다. ML에서는 보통 둘중 하나만을 estimate하지만 둘다 하는 경우도 있다. 


1) observational p( y | x ) : 일반적으로 supervised ML에서 estimate하는 값이다.

(What is the distribution of Y given that I observe variable X takes value x.)


2) interventional p( y | do(x) ) : 위와 같은 경우는 data를 '측정' (observed) 했을 때, p(y|x)를 구하는 방법이라면, 

이 방법의 경우, 데이터를 분석하는 사람이 데이터를 직접적으로 setting해서 지정했을때 Y의 distribution을 의미한다.(What is the distribution of Y if I were to set the value of X to x.) ( intervene 한다고 표현 : if I intervened in the data generating process by artificially forcing the variable XX to take value xx, but otherwise simulating the rest of the variables according to the original process that generated the data.)


Aren't they the same thing?


위의 두 conditional distribution은 다르다.

observational p( y | x )는 기존과 같이 x를 observe하고 그에 맞는 y를 예측하기 때문에 p(y|x)라고 표현이 된다.

그러나 interventional p( y | do(x) ) 의 경우 x의 값이 intervene된 경우이기 때문에 실제로 x와 y가 관련이 있다고 볼 수 없고 p(y|x)라고 보기 보다는 오히여 p(y)로 보는 것이 맞다고 할 수 있다.


Which one do I want?


둘 중에 어떤 것을 사용할지는 어떤 문제를 푸느냐에 따라 다르다. x가 자연적으로 발생하는 상황에서 y를 측정하는 task라면 observational p( y | x )를 사용하는 것이 적합하고 이것은 이미 supervised learning에서 사용하고 있다.

(this is what Judea Pearl called curve fitting. This is all good for a range of important applications such as classification, image segmentation, super-resolution, voice transcription, machine translation, and many more.)


그러나 x를 우리가 선택하는 경우는 p(y|do(x)) 를 사용해야 된다. 예를들어서 의료분야에서는 특정 치료법을 적용했을때  결과 (y)를 알고 싶을 때가 있다. 이때, x는 자연적으로 발생한 것이 아니라 인위적으로 설정한 x이고 (proactively choose , intervene) 이때는 p(y|do(x))를 사용한다.


What exactly is p(y|do(x))


p(y|do(x))는 측정하려면 실험자가 x를 control하며 수행하는 randomized controlled trials or A/B tests로 부터 data를 collect해야 된다. 그러나 실제로 이러한 수행자체가 어려운 경우가 많다. (의료 관련 실험의 경우 여러가지 제약이 있다.)

때문에 직접적으로 p(y|do(x))를 측정하기 어려운 것을 간접적으로 계산하는 것이 'causal inference and do-calculus'이다.


How are all these things related?


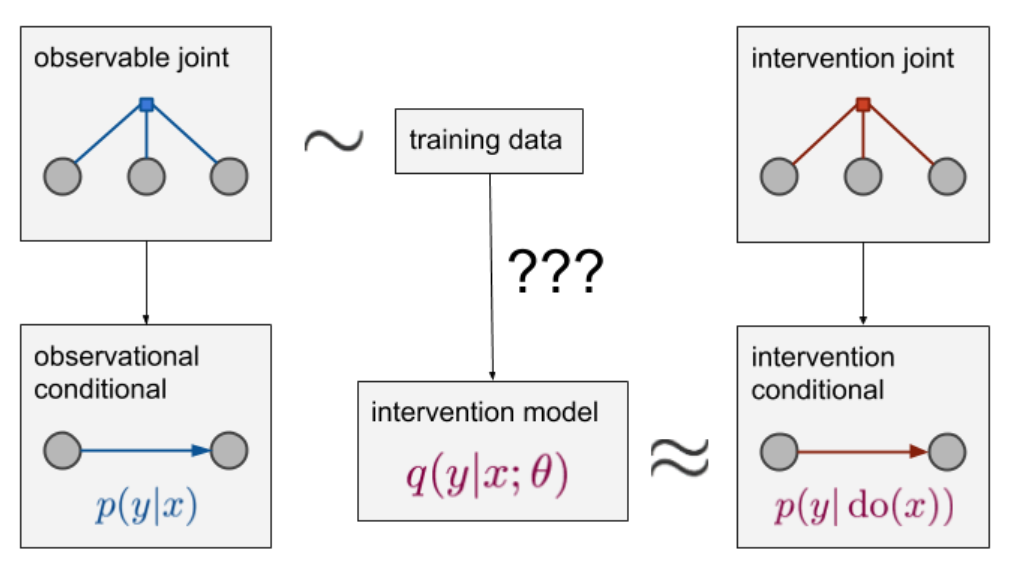
일단 p(y|x)에 맞춰서 그린 diagram을 살펴보자. observable joint라고 적힌 그림에 있는 동그라미 3개가 바로 변수를 의미한다. (x, z, y)그리고 파란색의 작은 사각형이 이 3개의 변수의 joint distribution을 의미한다.이때 x값으로 부터 y를 측정하기를 원하는 것이고, z는 측정은 가능하지만 현재 task에서는 관심없는 변수를 의미한다.이는 우리가 평소에 하던 deep learning network를 이용해서 cross entropy loss를 사용하면 학습이 가능하다.


그러면 p(y|do(x))를 구하면 싶으면 어떻게 해야 될까?


원래라면 오른쪽 그림처럼 intervention joint distributuion에서 sampling을 진행하여, 모델을 학습시키면 된다. 그러나 앞서 이야기 한 것처럼 직접적으로 intervention joint distribution에서 sampling하는것은 어렵거나 불가능할 수 있고, 때문에 observable joint distribution으로 부터 sampling하여 p(y|do(x))를 계산하여야 한다.


Causal models


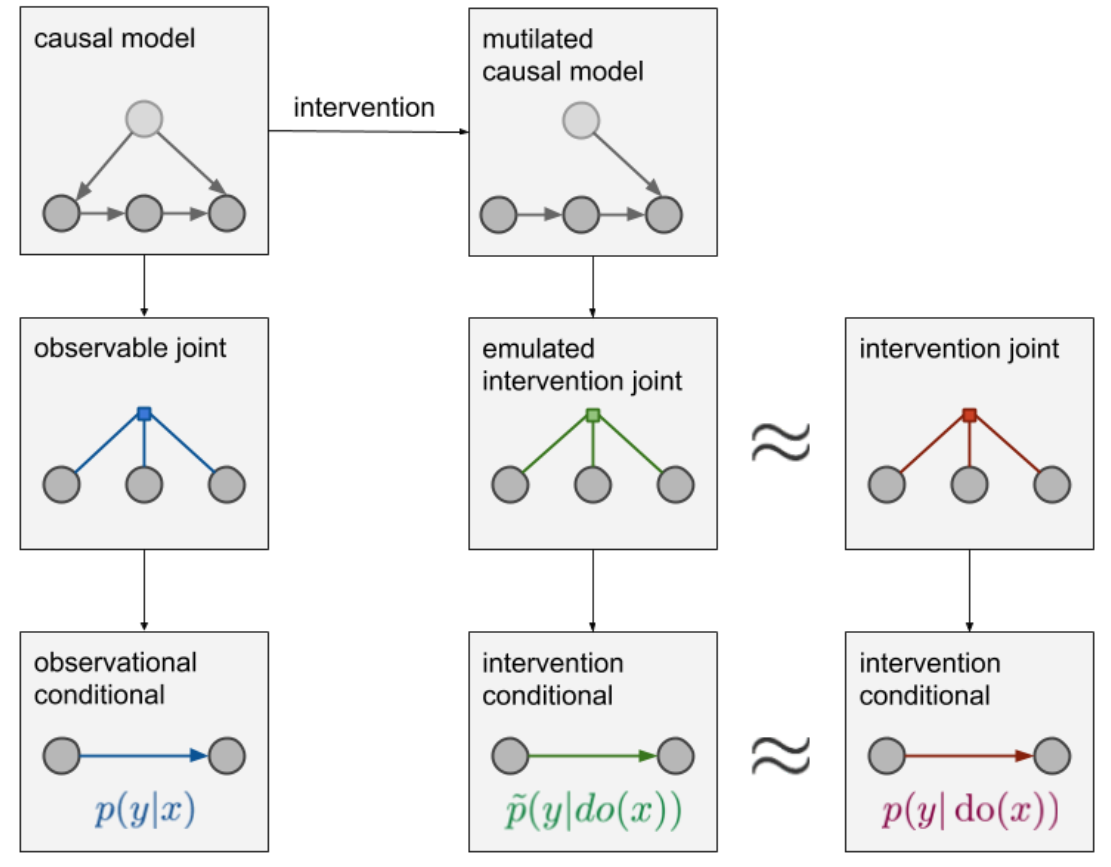
위와 같이 obervalble joint distribution에서 sampling한 data로 p(y|do(x))를 계산하려면, data간의 'causal structure'를 알고 있어야 한다. 이러한 data간의 causal 관계를 표현하면 아래 그림처럼 된다.

이렇게 causal 관계를 표현한식에서 intervention을 수행하는 것에 따라 우리는 기존의 causal model에서 mutilated를 수행할 수 있다. ( 기존 causal 관계도에서 화살표를 제거함) 이렇게 mutilated를 수행하여 우리가 원하는 x의 p(y|do(x)) 구하는 형태로 변형이 가능하다. (예시가 없어서 정확히는 이해 못했음) 이러한 과정을 거쳐서 원래의 intervention joint distribution을 근사한 emulated intervention joint distribution을 구할 수 있고, 따라서 p(y|do(x)) 또한 간접적으로 구할 수 있게 된다.


Do-calculus


이러한 과정에서 'Do-calculus'라는 것을 사용해서 수학적으로 표현할수 있다고 한다 (정확히 이해못함)


Summary


I wanted to emphasize again that this is not a question of whether you work on deep learning or causal inference. You can, and in many cases you should, do both. Causal inference and do-calculus allows you to understand a problem and establish what needs to be estimated from data based on your assumptions captured in a causal diagram. But once you've done that, you still need powerful tools to actually estimate that thing from data. Here, you can still use deep learning, SGD, variational bounds, etc. It is this cross-section of deep learning applied to causal inference which the recent article with Pearl claimed was under-explored.


728x90

'Math > Causal Inference' 카테고리의 다른 글

Part 3: Counterfactuals  (0) 2021.07.21
Part 2: Illustrating Interventions with a Toy Example  (0) 2021.07.16

+ Recent posts